es:scope®

Embedded Software Oscilloscope

Simplified testing and tuning of embedded software

Testing and tuning embedded software involves a great deal of effort. It is the hidden bottleneck in the development of embedded systems. Our embedded software oscilloscope es:scope® directly addresses this bottleneck to simplify the testing and tuning process of embedded software.

Testing and tuning: The Hidden Bottleneck of Embedded Software Development

We hear from developers that the challenge in development is often not only to solve technical problems, but also to communicate them within the team. Communication is particularly frustrating when the project effort is unpredictable and deadlines cannot be met as a result. 

In many cases, the unpredictability of tests and adjustments to the system software is responsible for this. If not everyone involved sees the whole picture, it is difficult to explain the causes. Test-driven development has evolved is often brought up as an argument. But for embedded software? The transfer is not straightforward. Embedded software interacts with real hardware, is subject to physical constraints and complex system dependencies. While many aspects can be simulated, real-time behaviour and system interactions still need to be tested on real hardware and iteratively adapted. 

This leads to bottlenecks: The testing and adaptation process is complex and unpredictable, often dependent on expensive, specialised setups.

Whitepaper on the application

Four keys to eliminating this bottleneck:

Easy configuration: The open middleware makes es:scope® hardware and interface-independent, making it incredibly versatile and easy to integrate into any existing system.

Lightweight execution: Minimal overhead ensures that the tests do not affect system performance, with as much data processing as possible being outsourced from the device under test to ensure smooth operation.

Validation in real time: Programmable data logging and real-time measurements of multiple high-speed signals are available directly via internal runtime variables - just as you would expect from an oscilloscope.

Calibration during runtime: Parameters can be adjusted on the fly in different numbering systems, with asynchronous commands enabling precise calibration - no need to restart the system.

Three areas where es:scope® can save money:

Streamlined testing process: es:scope® summarises the entire testing and coordination process in a single runtime step, significantly reducing the overall effort. We have seen testing time reduced from days to hours, saving thousands of euros in labour costs in a year.

Lower equipment costs: With es:scope®'s open, interface-independent middleware, expensive customised system adaptations or special test benches are no longer required for many test cases. In most cases, costly systems such as HIL or data loggers become superfluous, as the existing hardware and software can now fulfil the test requirements.

Improved risk management: es:scope® improves test coverage for hardware-dependent software and ensures that design errors are recognised early in the development cycle. This reduces the risk of costly rework and minimises the risk of product recalls or delays.

For embedded-developers

For a technical insight into the functionality of the software oscilloscope es:scope we have published an Article on elektronik.net and in Issue 15/16 of the electronics magazine This article can also be found here in our articleMeasure internal states of embedded systems(DE)“ gelesen werden.

Simplified Configuration with es:prot

The open-source protocol es:prot is integrated into the existing microcontroller code. With this protocol Variables, parameters and communication settings for measurement, validation and calibration are selected. Real-time data can now be tracked on the laptop and parameters adjusted via any serial interface.

As the plot window configurations of the signals can be preset in es:prot, a plug-and-play application is possible: an embedded system is connected to es:scope on a computer and the visualisation can be started. The measured values provided by es:prot are visualised and analysed by es:scope and the calibration parameters are described. The software can therefore be used in development, quality assurance and maintenance.

Real-time visualisation of the internal variables

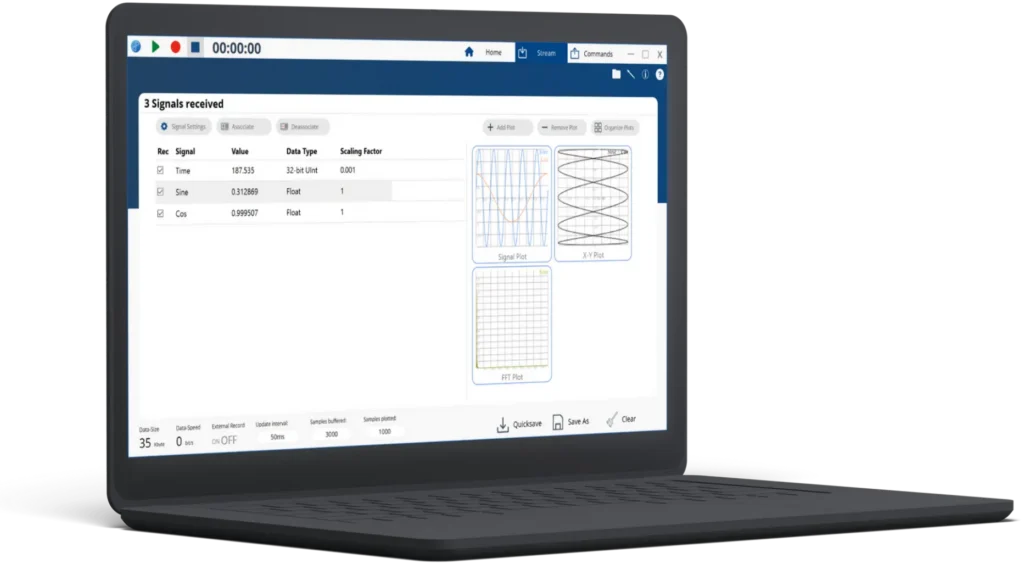
Data selected on the embedded system is transferred to es:scope and can be displayed in real time as numerical values, time diagrams, X-Y diagrams and FFT diagrams. The plot window is inspired by oscilloscopes. The signals are visualised here and their statistics are displayed. 

The setup focusses on control, validation and calibration tasks. Relevant signals can be tracked in real time in the plot windows. Similar to a traditional oscilloscope, signal triggers, cursor measurements, adjustable time windows and various display parameters are possible. The frequency spectrum of a signal can be tracked using a Fourier transformation, and the operating point of two variables can be determined using the XY display. Signal statistics provide additional information, such as the average value of the signal.

Flexible Recording of the measured variables

A recording can be started or stopped from es:scope or, if the user allows it, from the embedded system via es:prot. The latter allows the recording and storage of data to be controlled by the embedded system so that automated test procedures can be implemented or the times when the embedded system exhibits an anomaly can be explicitly investigated. Recorded data can be exported in tabular .xlsx, .csv or Matlab's proprietary .mat format. 

Adjustment of parameters at runtime

The Commands window is used to adjust parameters directly during operation via an input screen. The options for influencing operating behaviour using commands and a console are constantly being expanded.

es:scope

Supported interfaces

  • Serial (native USB & UART)
  • Ethernet (UDP)
  • FT4222 (SPI to USB bridge)
  • Others on request
  • DMA controller recommended

Data rate

Interface and controller-dependent
(e.g. USB up to 480 Mbit, FT4222 up to 30 Mbit)

Types of visualisation

Numerical values, time diagrams, X-Y diagrams, FFT diagrams


Available plots

Unlimited quantity.

Auto-assignment for 16 time diagrams, 4 X-Y diagrams and 8 FFT diagrams

Number of signal streams

64

Oscilloscope functionalities

Automatic scaling, trigger

Signal processing

FFT, min, max, average

Recording signals

Yes, manual / auto recording

File formats for export

Matlab, Excel, CSV

Exchange of commands between PC and controller

Yes, up to 64 User-defined

Terminal capability

Yes

Minimum requirement

Recommended

Processor

AMD64 / ARM v8 or comparable, 2 cores, 1.5 GHz

AMD64 / ARM v8 or comparable, 4 cores, 3 GHz

Memory (RAM)

6 GB

≥ 16GB

Hard drive

300 MB (HDD)

300MB (SSD/NVMe)

Screen resolution

720p

1080p or higher

Graphics unit

Integrated

Dedicated

Graphics memory (VRAM)

1 GB

≥ 4 GB

Supported operating systems

Windows, Linux (AMD64 and ARM(beta))

en_USEnglish